1. Executive Summary
TechFuji Hub is a multi-tenant operations console that consolidates the management of cloud, virtualization, compute, networking, databases, security, automation, help desk, projects, compliance, and reporting into one cohesive workspace. It is built around an outbound-only agent architecture, a role-based access model, and an AI Ops layer that continuously observes, recommends, and — where approved — acts.
Single pane of glass
Seventeen modules accessible from one collapsible sidebar, grouped into Overview, Infrastructure, Operations, Customer, and Admin.
AI Ops throughout
AI insights appear on the dashboard, automation, networks, databases, support, and compliance modules — surfacing predictions, cost savings, and remediation guidance.
Secure by design
Outbound-only agents (no inbound firewall rules), mTLS communication, tenant isolation, and granular role-based access control on every module.
2. Platform Architecture
The Hub is a React single-page application backed by a serverless BaaS platform. Each customer tenant receives an isolated workspace addressable via /portal/:tenantSlug/:page. Data, users, automations, and agent connections are scoped to the tenant. Connectivity to on-prem and cloud assets is established through lightweight agents that poll the Hub over outbound HTTPS, so no inbound ports need to be opened on the customer network.
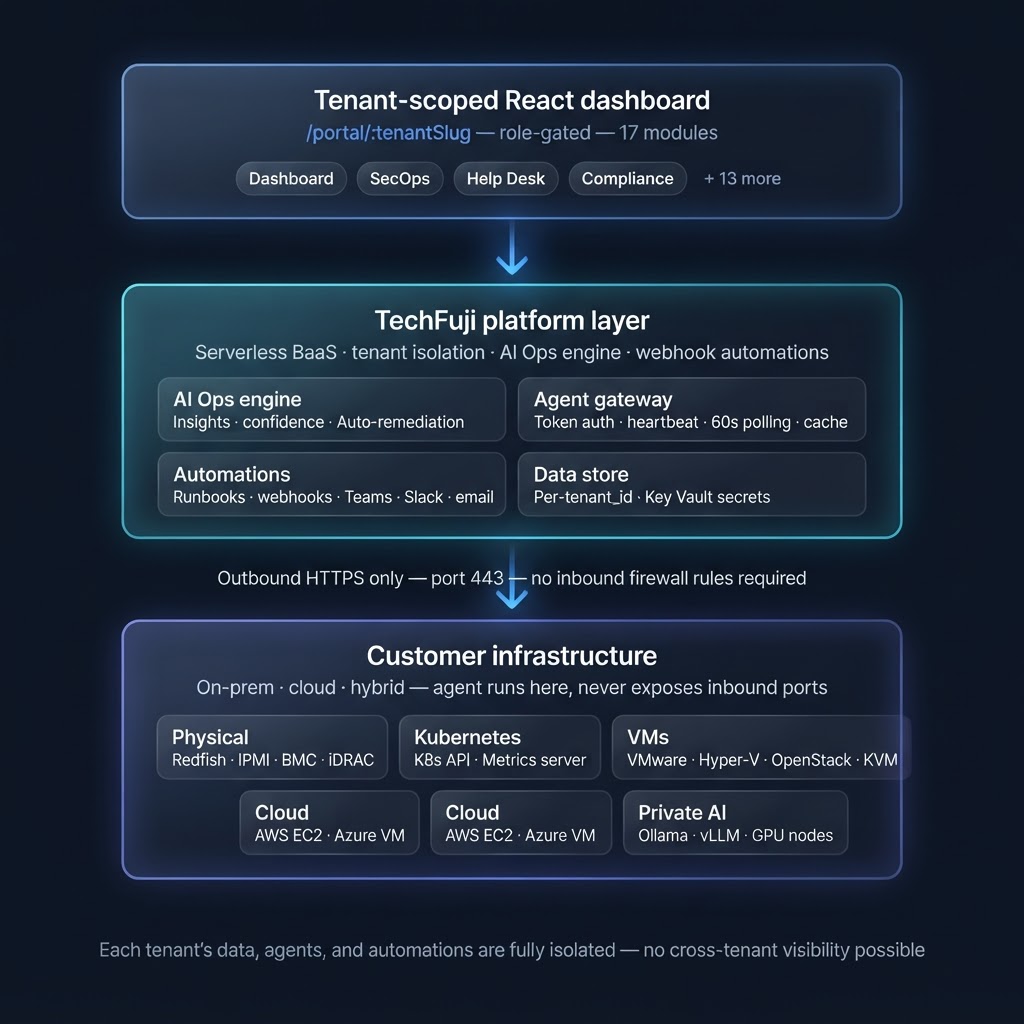
Agent connectivity
Agents register with a tenant-scoped token, report heartbeats every 60 seconds, and normalize telemetry before caching it. Connection types include agent (physical/Docker), cloud provider connectors, agentless network scans, and CI/CD pipeline integrations.
Tenant isolation
Every record carries a tenant_id. Routes, entities, and RBAC checks are evaluated per tenant, so one organization's data is never visible to another.
Automations & webhooks
Scheduled and event-driven automations run backend functions for ticket escalation, out-of-office reassignment, weekly IT reports, and Teams/email notifications.
3. Roles & Access Model
Access to each module is gated by role. Five roles are supported; unauthorized navigation redirects to the dashboard. A demo tenant (acme-corp) allows read-only exploration without authentication.
Five roles
admin — full control including settings, users, and infra submissions. ops — infrastructure, automation, deployments. security — SecOps, compliance, observability. support — help desk and tickets. viewer — read-only across visible modules.
4. AI Ops Layer
A pervasive AI layer — flagged with an AI Ops Active indicator in the top bar — generates insights across performance, cost, security, and reliability, and can operate in Recommendation Only or Approval-Required modes.
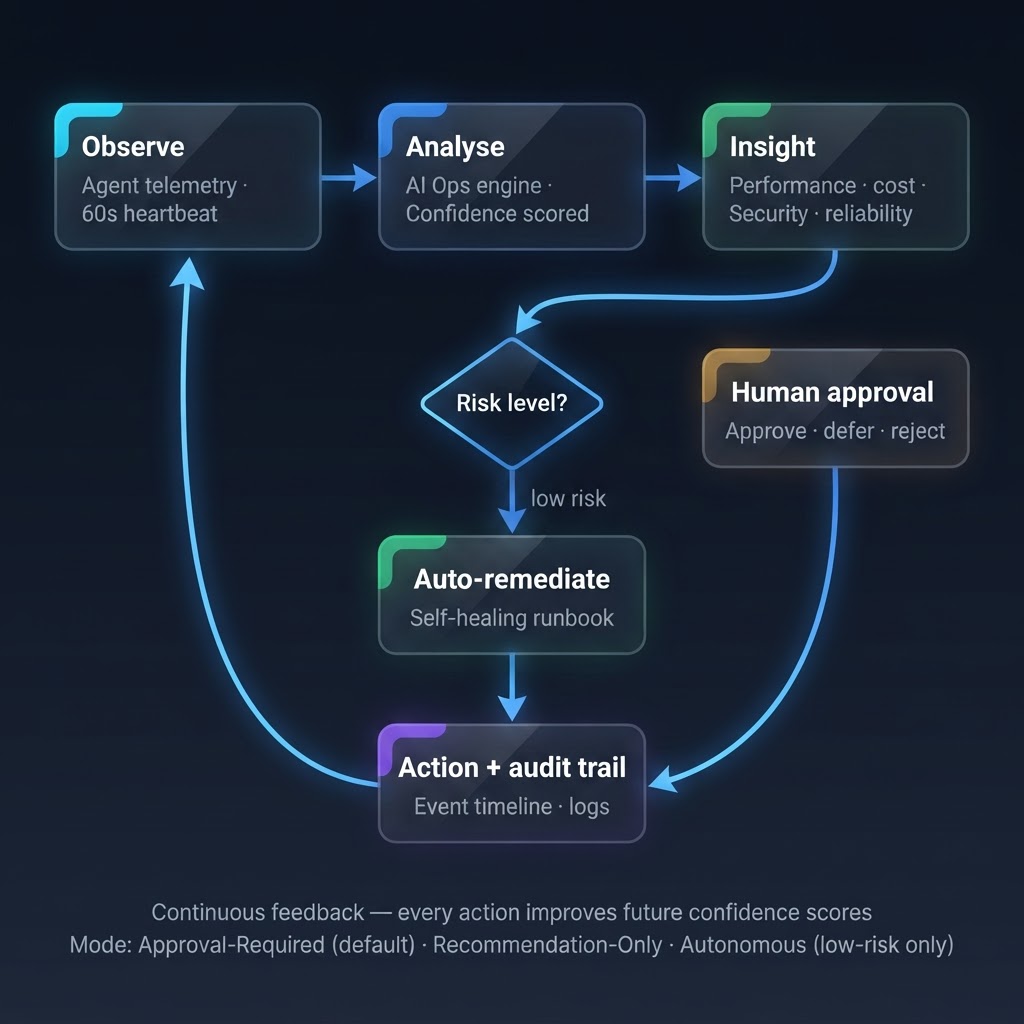
Insight types
Performance predictions (e.g. WAN congestion), cost optimization (right-sizing, savings), security recommendations (stale firewall rules, over-privileged identities), and reliability guidance — each with a confidence score and an action button.
Automation modes
AI recommends, human approves (default), or recommendation-only. Admins configure the mode. Self-healing runbooks can run automatically for low-risk remediations.
AI assistants
An LLM-powered support assistant answers infrastructure questions and a knowledge-base bot resolves help desk queries using past tickets.
5. Dashboard
The landing view — a real-time situational summary of the entire tenant.
Status banner
Operational status, infrastructure health, critical alert count, security posture score, and running automation jobs at a glance.
Quick-nav cards
Agents online, critical alerts, AI insights, and open tickets — each clickable to the relevant module.
Service domains grid
DevOps, Compute, SecOps, Observability, Networks, Databases, and Automation tiles with health dots and detail counts.
AI Ops insights panel
Live insights with type badges, confidence bars, automated flags, and one-click actions.
Agent health & event timeline
Healthy/warning/offline agent counts, heartbeat timestamps, and a chronological feed of alerts, automations, AI actions, and compliance events.
Cost & SLA summary
Monthly spend vs. last month, SLA uptime vs. target, and accumulated AI cost savings.
Deployment logs
Recent infrastructure deployment history with status, region, duration, and trigger source.
6. Connect Environment
A five-step wizard that onboards a new environment, generates a registration token server-side, and verifies the connection via live heartbeat events.
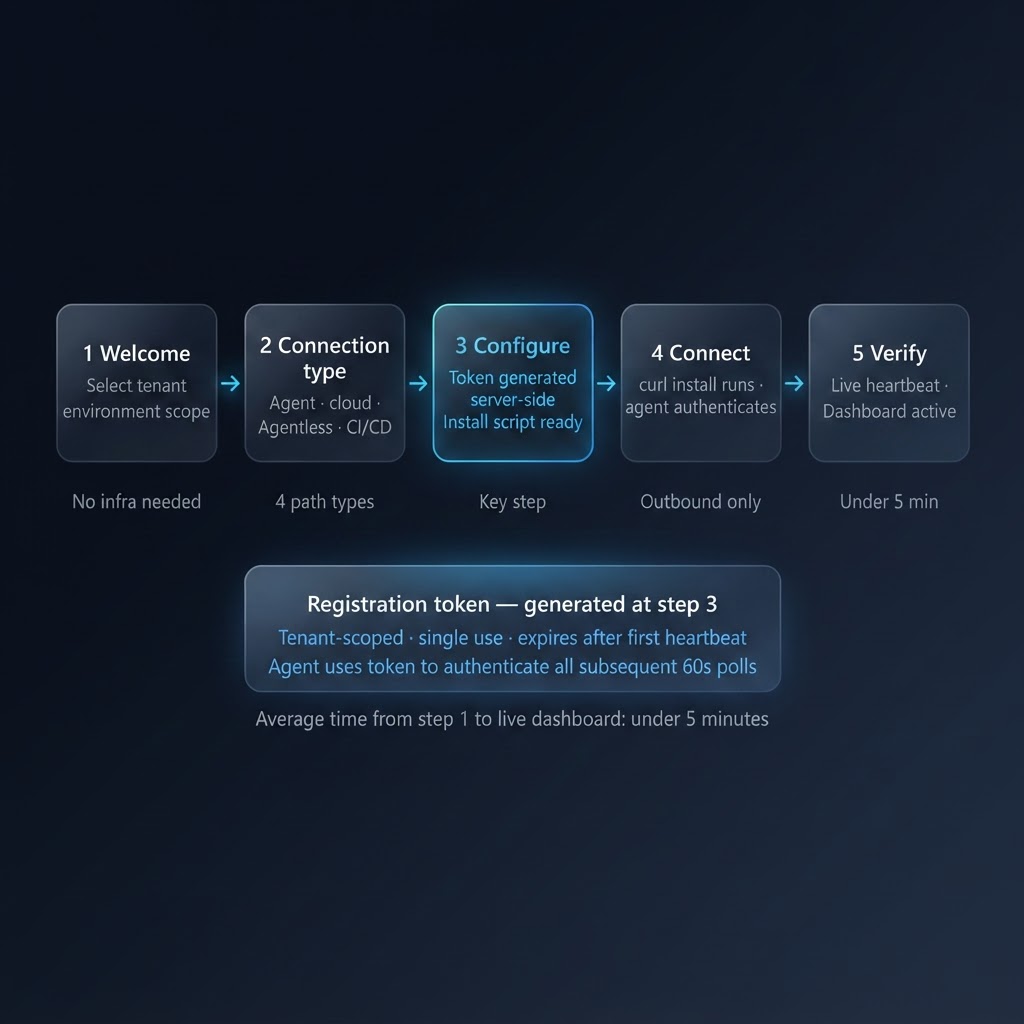
5-step wizard
Welcome → Connection type → Configure → Connect → Verify, with animated step transitions and skip/complete controls.
Connection types
Agent (physical or Docker, one-line curl install), cloud provider connectors, agentless network scans, and CI/CD pipeline hooks — each with tailored configuration paths and install scripts.
Token generation
Registration tokens are generated eagerly via a server-side endpoint at step 2 and used by the agent to authenticate its heartbeat.
Verification
A live connection state (connected/scanning/active/degraded/offline) updates as the agent's first heartbeat arrives; a DEV_MODE simulation enables preview testing.
7. Services & Agents
A live inventory of deployed services and the agents reporting on them.
Service cards
Per-service provider (AWS/Azure/GCP/Cloudflare), type, region, instance count, CPU and memory bars, and health status — filterable by status.
Connected agents table
Agent name, OS, IP, version, last heartbeat, and status with color-coded health indicators.
8. Service Catalog
A self-service marketplace of production-ready infrastructure templates that can be provisioned without writing IaC directly.
Template library
Categorized by Compute, Database, Networking, Security, and DevOps; filterable by platform; searchable by name, description, or resource. Featured templates are highlighted with badges and deploy-time estimates.
3-step provisioning wizard
Configure (dynamic inputs per template — environment name, region, instance size, storage) → Review (summary of selections) → Deploy (simulated real-time provisioning with status updates).
Deployment logging
Each provisioning run automatically creates a DeploymentLog record tracking event, environment, template, status, region, duration, and trigger source — visible on the dashboard.
9. Compute
A tabbed console — Overview, Security, and Patching — covering compute adapters, vulnerability posture, and patch management, with deep-link support via ?tab= and ?focus= parameters.
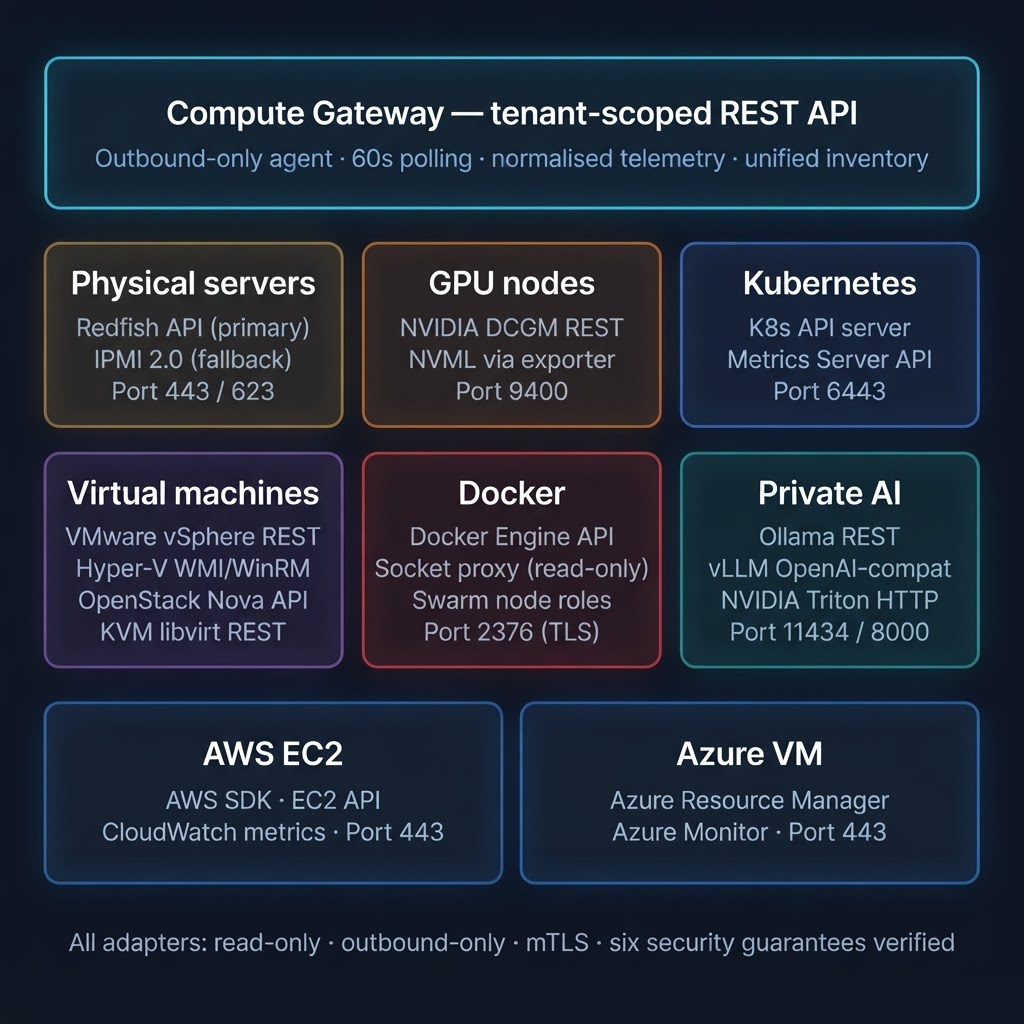
Overview
Summary stats, an active Compute Gateway banner (tenant-scoped REST API, outbound-only agent, 60s polling), a 4-step onboarding mini-wizard with one-line agent install, adapter cards (physical, virtualization, Docker, Kubernetes, GPU/AI) with CPU/memory/temp/utilization metrics, and a protocol reference table (primary/fallback/port per sub-section).
Security panel
Vulnerability findings, security posture per compute asset, and cross-links into the patching tab for remediation.
Patching panel
Patch-now flows with defer modal, patch reference matrix, and simulated patch execution that updates asset security state.
10. Networks
Network device inventory and traffic intelligence.
Device inventory
Per-device type, location, uptime, latency, bandwidth utilization, and status — with threshold-based color coding.
Top interfaces & events
Highest-utilization interfaces with in/out throughput and a recent-events feed scoped to the network domain.
AI network insights
Predictive alerts (e.g. WAN congestion forecast in ~4 hours) and security recommendations (e.g. stale firewall rules unused 90+ days) with mitigate/review actions.
11. Databases
Database health, query performance, and backup posture across instances.
Instances
Per-instance type/version, region, size, replication, connection saturation, CPU, replica lag, and status.
Slow query analysis (AI optimized)
Flagged slow queries with average duration and frequency, plus an AI suggestion and one-click "Apply" to apply the recommended optimization.
Backup status
Backup type, size, retention, last-run, and status per database, with manual backup triggering.
12. Automation
Runbook orchestration with human-in-the-loop approval and an event timeline.
Runbooks
Triggerable runbooks with targets, last-run times, and an approval-required workflow that routes to a human before execution.
Event timeline
Chronological feed of alert, automation, agent, manual, AI, and compliance events with outcomes.
AI automation mode
Configurable Recommendation-Only vs. Approval-Required modes, with self-healing runbooks for low-risk remediations.
13. Observability
System performance, service health, and active alerting.
Performance chart
24-hour CPU, memory, and latency trend visualization.
Service health
Per-service uptime, latency, and incident counts with healthy/warning/degraded status.
Active alerts
Critical, warning, and info alerts with timestamps and contextual messages.
14. SecOps
A Wiz-style security operations console with an icon rail and ten sub-sections.
Overview & Workspaces
SecOps dashboard with posture scoring, and multi-workspace boards for organizing security operations.
Alerts & Intel
Alert triage with severity, and a threat-intel dashboard for live threat monitoring.
Detections & Assets
Findings with remediation guidance, and a full asset inventory of discovered cloud and on-prem resources.
Security Graph Explorer
Query resource relationships, blast radius, and lateral-movement paths using a graph query language (e.g. find internet-facing resources with critical CVEs).
Controls, Compliance & Config
Policy controls, per-framework compliance reports, and SecOps configuration — with a live "Respond" action and a live-status indicator.
15. Help Desk
A complete IT support portal with thirteen sub-modules organized into Overview, Support, Knowledge, IT Operations, and Admin.
Dashboard & Analytics
Help desk home with widget overview, and an analytics dashboard for ticket volume, category, and SLA trends.
SLA Tracker
Real-time SLA monitoring against targets with breach risk indicators.
AI Chat & Tickets
LLM-powered assistant chat, plus a full ticket system with AI auto-tagging, priority, assignment, and escalation.
Service Catalog & My Requests
Employee request wizard (new laptop, domain ID, onboarding, VPN, software, access) and a personal request tracker with approval workflow.
Knowledge Base & AI Assistant
Searchable KB articles and an AI assistant trained on past tickets to deflect repetitive questions, with feedback capture.
Asset Manager & Onboarding
IT asset lifecycle (laptops, monitors, licenses) with checkout/check-in, signatures, and employee onboarding workflows.
Vendors & Agent Builder
Vendor and contract management with expiry alerts, and a no-code agent builder for custom help desk assistants.
16. Support
A combined ticket queue and AI support assistant.
Ticket pipeline
Expandable tickets with a 5-stage pipeline (Submitted → Assigned → In Progress → Under Review → Resolved), priority badges, and a new-ticket form.
AI support assistant
An LLM chat that answers infrastructure and IT operations questions and can create tickets, with a persistent conversation thread.
17. Projects
Delivery tracking for custom software, mobile app, and migration engagements.
Project list & detail
Status (in progress/planning/completed/on hold), progress bars, phase, and type — with a selectable master-detail layout.
Sprint & milestones
Current sprint progress, milestone checklist, manager, due date, and open PR count.
CI status & linked tickets
CI pass/fail badge, tech stack tags, and a count of open tickets linked to the project.
18. Compliance
Security posture scoring against major frameworks with drill-down and export.
Posture score ring
An overall security posture score (0–100) with a color-coded ring and per-standard scores (CIS, SOC 2, ISO 27001) showing passed/total controls.
Category breakdown
Expandable per-standard category-level pass/fail ratios for granular gap analysis.
Findings & remediation
Recent findings with severity, standard, control, affected asset, and inline remediation guidance — with one-click report downloads.
19. Reports
Executive reporting across SLA, cost, and security with multi-format export.
SLA & uptime
Six-month uptime trend chart with target line, recent incidents table (duration, service, impact, root cause), and CSV export.
Cost reports
Monthly spend summary, cost-breakdown bar chart, and an AI cost-savings panel itemizing automated optimizations.
Security reports
Per-framework (CIS/SOC2/ISO27001) score cards with progress bars and CSV, Excel, and PDF export — plus a bulk "export all findings" option.
20. Infra Submissions
An administrative intake for infrastructure requirement-gathering forms submitted from the public Cloud Services page.
Submission table
Company, contact, email, submission date, and a status dropdown (new/contacted/qualified/closed) that persists inline.
Detail dialog
Full submission details rendered from the structured message body, with per-submission CSV download.
Bulk CSV export
One-click export of all submissions to CSV for downstream processing.
21. Settings
Tenant administration across people, integrations, and notifications.
Users & roles
Team member roster with role badges and status, plus email invitations with role selection (viewer → admin).
Integrations
Connect and configure PagerDuty, Slack, Jira, Datadog, and more — with connection status and an add-integration entry point.
Notification preferences
Toggles for critical alerts, agent offline, automation results, weekly compliance summaries, and AI insight notifications.
22. Functional Requirements
Functional requirements describe what TechFuji Hub does — the concrete capabilities the platform delivers to operators, administrators, and end users across every module.
Tenant & access management
Multi-tenant workspace provisioning (/portal/:tenantSlug), five-role RBAC (admin, ops, security, support, viewer), email invitations with role selection, and unauthorized-navigation redirection to the dashboard.
Environment onboarding
Five-step wizard (Welcome → Connection Type → Configure → Connect → Verify) with four connection types (agent, cloud, agentless, CI/CD), server-side registration token generation, and live heartbeat verification.
Compute adapter framework
A pluggable adapter model spanning physical servers, virtualization, Docker, Kubernetes, and GPU/AI compute — each adapter normalizes telemetry (CPU, memory, temperature, utilization) into a consistent view, with a primary/fallback protocol and port per adapter and deep-linkable Security and Patching sub-panels.
Infrastructure monitoring
Real-time inventory of compute, network, and database assets with CPU/memory/latency/bandwidth metrics, threshold-based health status, and a 24-hour performance trend visualization.
Security operations
SecOps console with posture scoring, alert triage, findings with remediation guidance, full asset inventory, a security graph explorer, and policy controls — plus compute vulnerability posture and patch-now flows with deferral.
Service catalog & provisioning
Self-service template library (Compute, Database, Networking, Security, DevOps) with a 3-step provisioning wizard and automatic DeploymentLog creation tracking event, environment, template, status, region, and duration.
Automation & runbooks
Triggerable runbooks with human-in-the-loop approval, a chronological event timeline, and configurable Recommendation-Only vs. Approval-Required AI automation modes.
Help desk & IT operations
Ticket system with AI auto-tagging/priority/assignment/escalation, SLA tracking, employee request wizard, asset lifecycle with checkout/signatures, vendor & contract management, a knowledge-base AI assistant, and Microsoft 365 directory integration for user lookup, group membership, and license visibility.
Compliance & reporting
Security posture scoring against CIS, SOC 2, and ISO 27001 with category breakdowns, findings with remediation, and SLA/cost/security reports exportable to CSV, Excel, and PDF.
AI Ops layer
Pervasive AI insights (performance, cost, security, reliability) with confidence scores and one-click actions, plus LLM-powered support and knowledge-base assistants.
Admin intake
Infrastructure requirement-gathering form intake with inline status management, detail dialog, per-submission CSV, and bulk export.
23. Non-Functional Requirements
Non-functional requirements describe how the platform behaves — the quality attributes that govern performance, security, reliability, and operability under real-world conditions.
Security & isolation
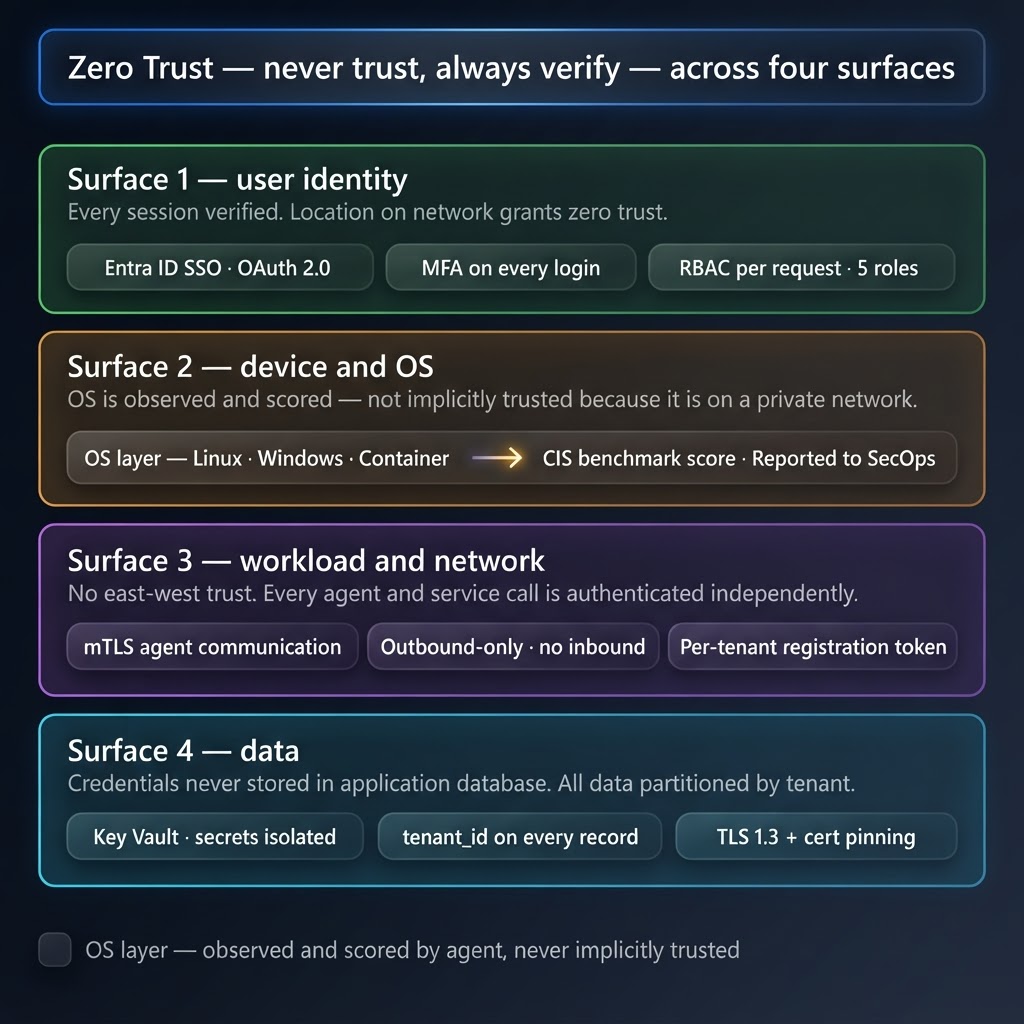
Outbound-only agent architecture (no inbound firewall rules), mTLS-encrypted agent communication, strict tenant isolation via per-record tenant_id, and RBAC enforcement on every module and API.
Performance & responsiveness
Agent heartbeat polling at 60-second intervals with dashboard data refreshed within 60 seconds of an agent event; pages render initial content within 2 seconds on a standard connection, and inline edits apply optimistically with client-side validation to minimize round-trips.
Availability & reliability
Serverless BaaS backend with managed scaling, real-time WebSocket subscriptions for live state updates, and a degraded-mode behaviour model — when an agent misses its heartbeat, its status transitions through warning to offline and the dashboard surfaces degraded assets rather than failing silently.
Scalability
Each tenant's data grows independently without affecting others; dashboards remain responsive as asset and event counts increase; and bulk operations handle large inventories in a single request rather than per-item calls.
Data retention & deletion
Entity records retain created and updated timestamps for audit traceability; administrators can export and purge tenant-scoped records on request, and agent telemetry caches age out automatically when no longer reported by a live agent.
Browser & device support
Responsive across desktop, tablet, and mobile browsers; a collapsible sidebar adapts to small screens; all core modules are usable on Chromium, Firefox, and Safari without additional software.
Maintainability & extensibility
Modular React component architecture (focused, ≤50-line components), a serverless function layer for external integrations, a no-code agent builder for custom help desk assistants, and a pluggable integrations registry (PagerDuty, Slack, Jira, Datadog).
Auditability & traceability
Deployment logs capture every provisioning event with trigger source and duration; automations and AI actions are surfaced in event timelines; contact submissions carry a status audit trail (new → contacted → qualified → closed).
Usability
Responsive mobile + desktop design, a collapsible sidebar grouped by domain, deep-linkable tabs (?tab=, ?focus=), a sticky table of contents, and consistent iconography and status color coding across all modules.
Compliance-readiness
Built-in framework alignment (CIS, SOC 2, ISO 27001) with posture scoring, configurable notification preferences, and data-respecting outbound-only connectivity suitable for regulated environments.
24. Roadmap & Conclusion
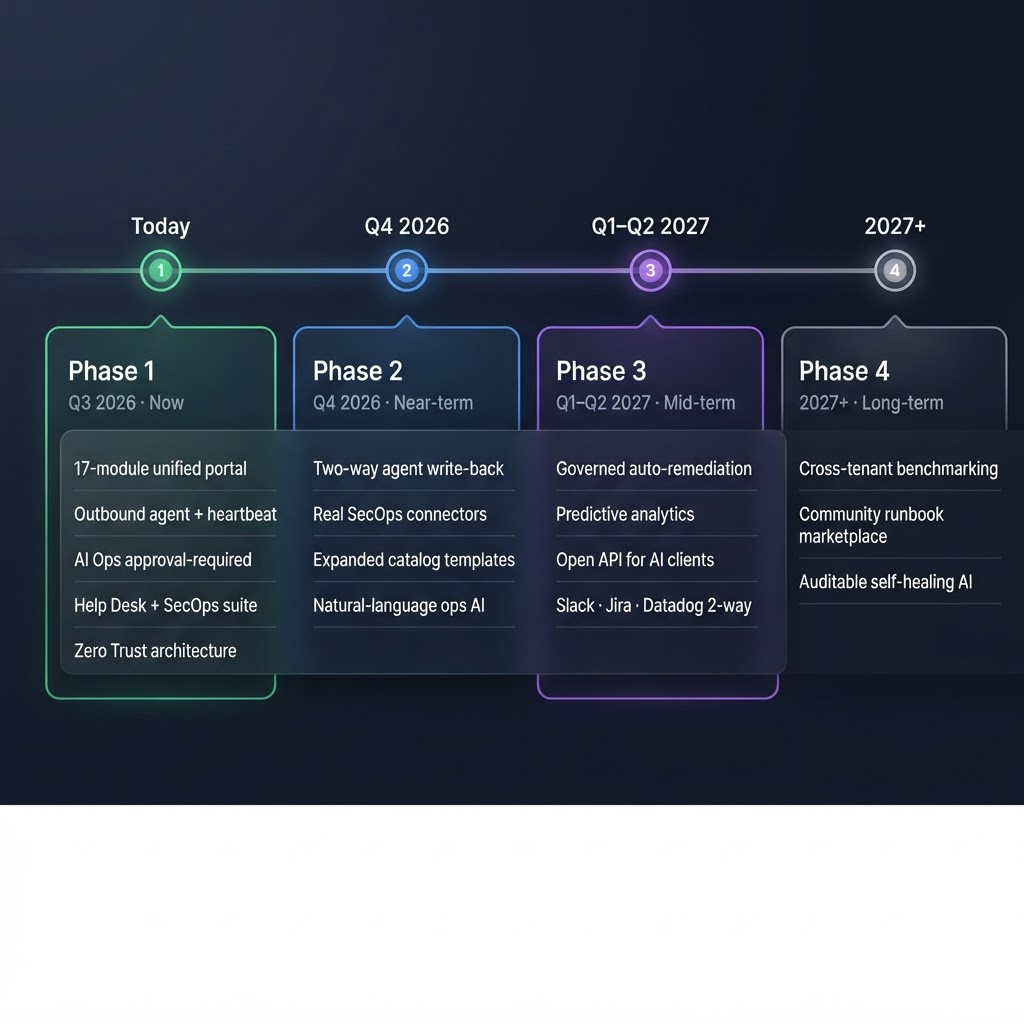
TechFuji Hub delivers a unified, secure, AI-augmented operations workspace today, with a phased path to deeper automation, intelligence, and extensibility.
Phase 1 — Now (Q3 2026)
Unified 17-module tenant-scoped portal, outbound-only agent connectivity with token registration and heartbeat verification, the AI Ops layer in approval-required mode, service catalog provisioning with deployment logging, and the full help desk + SecOps + compliance suite.
Phase 2 — Near-term (Q4 2026)
Deeper two-way agent provisioning (write-back actions), real SecOps connector ingestion (cloud posture APIs), expanded catalog templates across all platforms, and natural-language operations via the in-app AI assistant.
Phase 3 — Mid-term (Q1–Q2 2027)
Progression from approval-required toward governed autonomous remediation for low-risk issues, richer predictive analytics (capacity, cost, failure forecasting), the ability to expose tenant operations data to approved external AI tools so they can query and act on it, and expanded two-way integrations (Slack, Jira, Datadog).
Phase 4 — Long-term (2027+)
Cross-tenant benchmarking and best-practice recommendations, a self-service marketplace for community runbooks and templates, federated multi-region tenant deployments, and AI that automatically detects and fixes low-risk issues while logging every action for audit.
Conclusion
By unifying infrastructure, security, automation, help desk, and compliance under one tenant-scoped, role-aware, AI-native roof, TechFuji Hub reduces tool sprawl, accelerates incident response, and turns operational data into continuous improvement — with a clear roadmap toward increasingly autonomous, intelligent operations.